


A street sign for Wall Street is seen in the financial district in New York, U.S., November 8, 2021. REUTERS/Brendan McDermid/File Photo
Analysis: U.S. Treasuries yield curve flashes red to investors
- Finance News World
 Global Business Magazine
- 8 minutes read
The U.S. Treasury yield curve is flashing a warning sign to Wall Street, where many are worried that a recession could be in store after bond investors pushed up short-term rates to the point where yields on the two-year Treasury were actually higher than the 10-year Treasury.
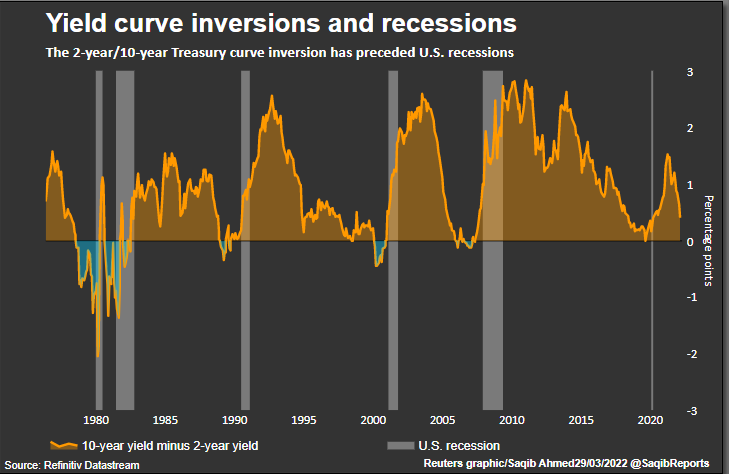
Such a phenomenon, called a “yield curve inversion,” is a key metric that investors watch as bond yields impact other asset prices, feed through to banks’ returns and have been an indicator of how the economy will fare. Aside from signals it may flash on the economy, the shape of the yield curve has ramifications for consumers and business. read more
On Tuesday, one of the most closely watched parts of the curve, the two-year to 10-year curve , briefly inverted, after weeks of sharp moves in the U.S. Treasury market, where investors have sold off Treasuries anticipating aggressive interest rate hikes from the U.S. Federal Reserve which is fighting surging inflation.
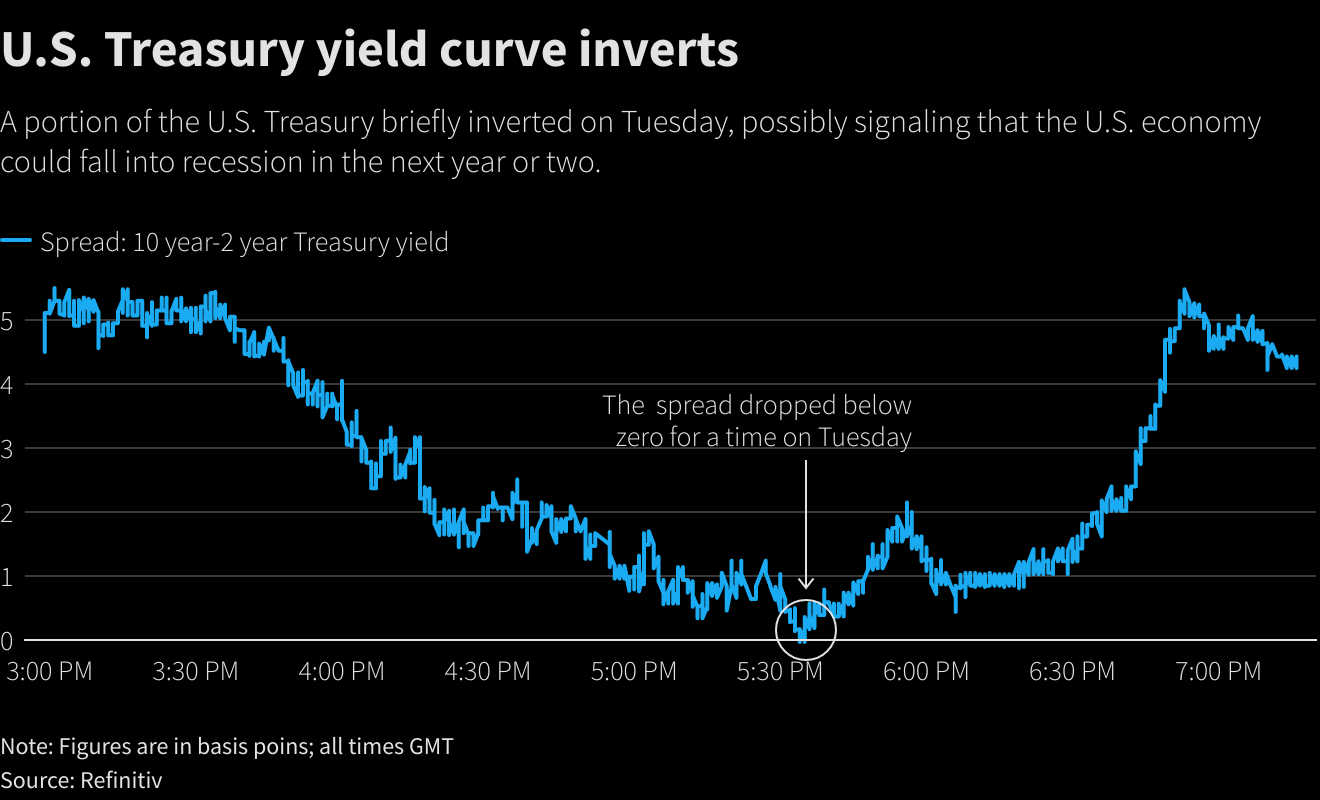
That has sent a warning sign for investors that a recession could follow. The last time it inverted was 2019 and the following year, the United States entered a recession – albeit one caused by the global pandemic. read more
“A lot of people focus on this and there could be a self-fulfilling expectation, they see the 10 year/2 year invert and believe there will be a recession and change behavior,” said Campbell Harvey, professor of finance at the Fuqua School of Business, Duke University, who pioneered using the yield curve as a predictive tool for recessions. “So if you’re a company you cut back capex and employment plans.”
Harvey, who focused his research on a different part of the yield curve, added that being prepared for a recession was “not a bad thing… so when it occurs you survive.”
Broker-dealer LPL Financial said the 2/10 inversion is “a powerful indicator” pointing out that it predated all six recessions since 1978, with just one false positive.
According to Anu Gaggar, global investment strategist for Commonwealth Financial Network, the lag between curve inversion and the start of a recession has averaged about 22 months but has ranged from 6 to 36 months for the last six recessions.
Some investors caution that the yield curve is just one indicator among many to look for when predicting recession. Indeed, equity markets have shot higher in recent weeks, with the S&P 500 cutting its year-to-date loss to around 3% after confirming it was in a correction last month.
For many market participants, however, the curve has become a classically followed signal.
“There is definitely a psychological element to it,” said Gennadiy Goldberg, senior rates strategist at TD Securities. “The yield curve has worked in the past because it has been a signal that the end of the cycle is coming.”
CLOSELY FOLLOWED
Yields of short-term U.S. government debt have been rising quickly, reflecting expectations of a series of rate hikes by the U.S. Federal Reserve, while longer-dated government bond yields have moved at a slower pace amid concerns policy tightening may hurt the economy.
As a result, the shape of the Treasury yield curve has been generally flattening and in some cases inverting.
Not everyone is convinced the curve is telling the whole story. Some say the Fed’s bond buying program of the last two years has inflated the price of 10-year Treasuries, keeping the yield artificially low. They say the yield is bound to rise when the central bank starts shrinking its balance sheet, steepening the curve.
Clouding the picture further, different parts of the yield curve have been sending different signals. read more
While financial markets see the two-year yield as a good proxy for Fed policy and closely follow the 2/10 part of the curve, many academic papers favor the spread between the yield on three-month Treasury bills and 10-year notes . This yield curve has not indicated recession.
Eric Winograd, senior economist, AllianceBernstein said discussion of the yield curve inversion was “overheated.”
“I understand the narrative and I think from a risk-taking perspective there is good evidence that a flat or inverted yield curve is a challenge for broader risk assets but I am not going to worry more about a recession if the yield curve inverts by 5 basis points or doesn’t,” Winograd said.
Investors may be more dismissive of an inversion this time around, as the Fed remains very early in the hiking cycle, with time to ease off the brakes if the economy appears to be slipping into a downturn, TD’s Goldberg said.
Researchers at the Fed, meanwhile, put out a paper on March 25 that suggested the predictive power of the spread between two- and 10-year Treasuries to signal a coming recession is “probably spurious,” and suggested a better herald of a coming economic slowdown is the spread of Treasuries with maturities of less than two years.
Still, for some, the trend is not to be ignored.
“When things invert you are definitely much closer to a recession than a good outcome and that’s exactly where we are today,” said Edward Al Hussainy, senior interest rate and currency analyst at Columbia Threadneedle. “It’s clear we have arrived at a point of stress in markets.”
Reporting by Megan Davies, Ira Iosebashvili, additional reporting by Lewis Krauskopf, Dan Burns and David Randall; Writing by Megan Davies; Editing by David Gregorio and Andrea Ricci
This article was originally published by Reuters.